

 Start a conversation
AI system design and integration
Measuring an AI system after launch: the framework that actually proves it's working
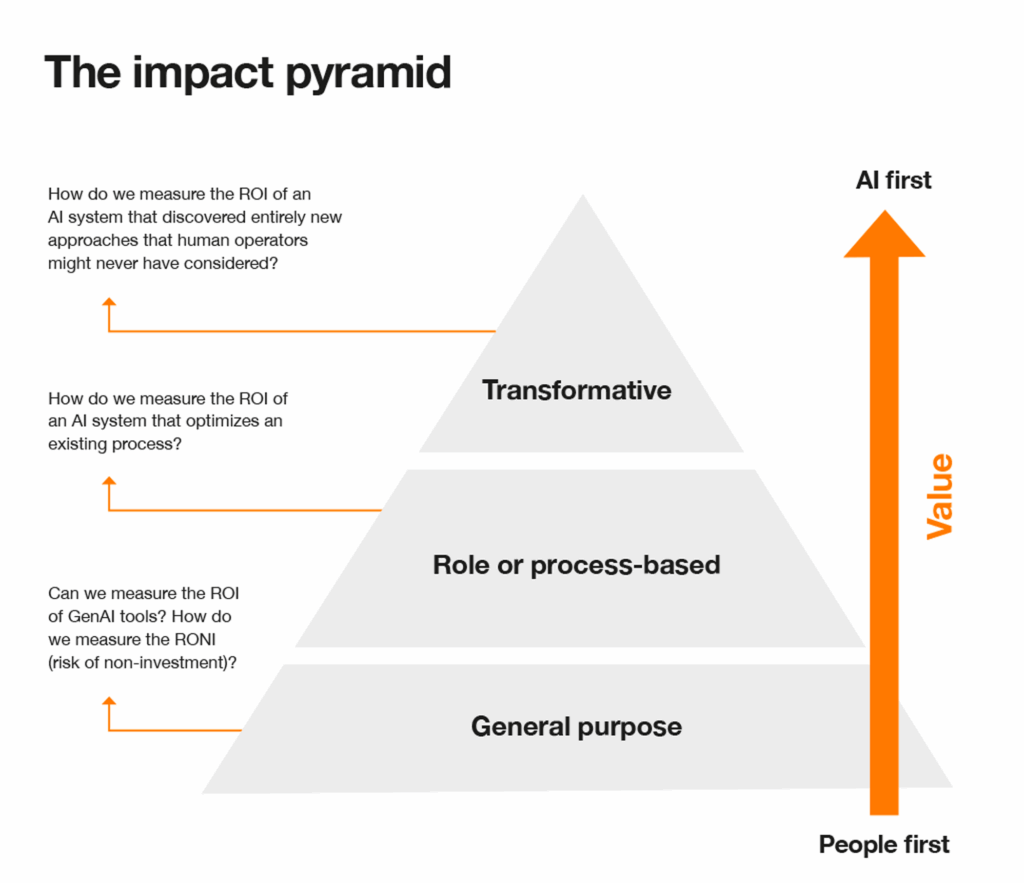
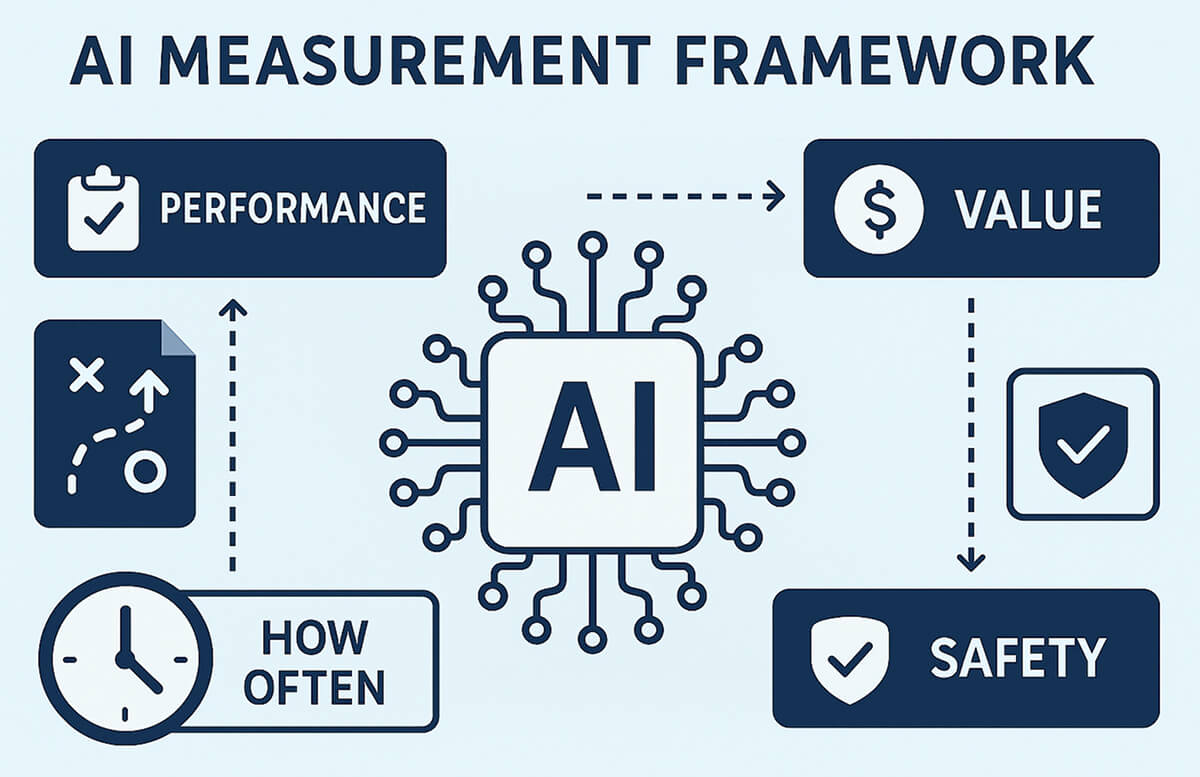
Measuring an AI system after launch means tracking four layers against a pre-launch baseline: system integrity (uptime, latency), output quality (accuracy, hallucination rate), adoption (retention, not just activation), and business impact (containment, cost per interaction, ROI). You review all four on a cadence that gets lighter as the system stabilises, starting weekly and settling into monthly once the numbers hold steady. If you skip the baseline, none of the rest means anything, because you'll have no process to compare it against.
Most teams get this wrong not because they lack dashboards, but because they built the dashboard after the system went live.
Why most post-launch measurement fails before it starts
The baseline problem: you can't measure improvement against a process you never documented
If you didn't record how long it took a human to resolve a query, how many queries came in per day, and what the error rate was before the bot, you have no honest way to claim the bot improved anything. "Faster than before" requires a "before." This is the single biggest gap we see when reviewing systems that were handed to us mid-flight. Teams can tell us the bot's containment rate is 72%, but they can't tell us what containment looked like when a human was doing it manually, because nobody measured it. Without that number, 72% is just a number. It's not an argument.
Vanity dashboards: why requests processed isn't the same as value delivered
"Messages handled" and "conversations processed" are easy to report and easy to inflate. A bot that replies to 10,000 messages a month looks busy. It says nothing about whether those replies solved anything, whether customers left satisfied, or whether a human had to step in five minutes later to fix it. Volume metrics make for good slides and bad decisions. If your weekly report leads with a volume number instead of an outcome number, you're building a vanity dashboard, not a measurement system.
What to capture before go-live if you still can
If you're reading this before launch, capture four things now: average handling time per query type, current error or complaint rate, current staff cost per interaction, and current customer satisfaction score (even a rough one from support tickets). If you're reading this after launch and didn't capture a baseline, the next best option is a 30-day parallel run comparing bot-handled and human-handled tickets side by side, or reconstructing the baseline from historic support logs. It's imperfect, but it's better than nothing.
The four layers to track after launch
System integrity: uptime, p50/p95 latency, error rate
This is the infrastructure layer, and it's the easiest to get wrong by ignoring it. Track uptime as a percentage of the billing period, not just "is it currently working." Track p50 latency (the median response time) and p95 latency (the slow tail that frustrates your worst-case users). Track error rate separately from hallucination rate; a 500 error from a broken API call is not the same failure mode as the model confidently inventing a delivery date. If workflows are failing silently in the background, you won't see it in a chat transcript, which is exactly why teams building on n8n need to stop workflows from failing silently rather than discovering gaps during a client complaint.
Output quality: accuracy, hallucination rate, drift
Accuracy means the answer was factually correct against your source of truth. Hallucination rate means the model stated something with confidence that wasn't true, which is a distinct and more dangerous failure than simply not knowing. Drift means the model's outputs are quietly changing in quality or tone over time, often because the data it's querying has changed, your product catalogue updated, or usage patterns shifted outside its training distribution. All three need sampling, not just automated scoring. Pull 20 to 30 real conversations a week and read them.
Adoption: activation vs three-month retention
Activation tells you people tried it once. Retention tells you they came back. A WhatsApp bot with a 40% activation rate in week one and a 5% three-month retention rate is not succeeding, it's being tolerated once and avoided afterward. Track retention cohorts (week 1, week 4, week 12) the same way you'd track a subscription product, because that's effectively what you built.
Business impact: containment, resolution, cost per interaction
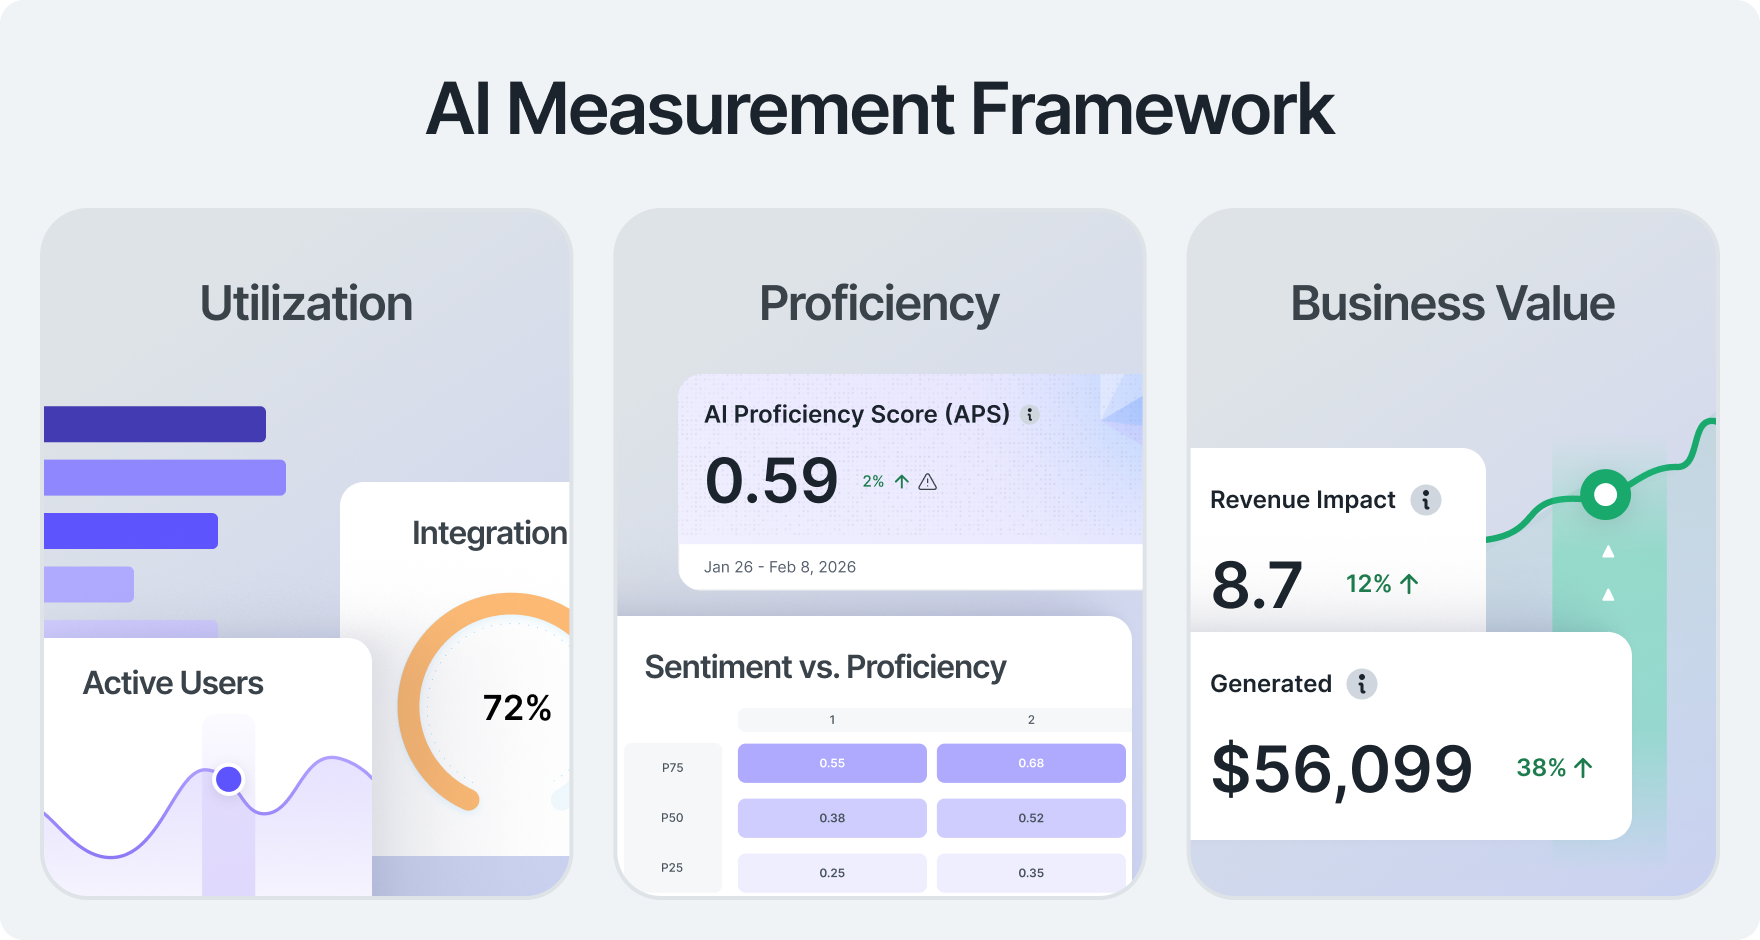
Containment, resolution, and cost per interaction are the numbers that actually get reported to a finance committee. Cost per interaction should include Meta's conversation-based pricing, your platform fee, and the amortised build cost, not just the marginal API call. This is also where most ROI arguments collapse, because teams compare bot cost per interaction to zero instead of to the real cost of the human alternative.
Containment rate vs resolution rate: the metric most teams get wrong
Why a high containment rate can hide a bad experience
Containment rate measures whether a conversation ended without a human agent stepping in. It does not measure whether the customer got what they needed. A bot can "contain" a frustrated customer by giving a vague non-answer that technically ends the chat. That's a contained conversation and a lost customer. Containment is necessary to report, but it is not sufficient on its own, and treating it as the headline number is how teams end up optimising for the wrong outcome.
Using repeat contact rate to measure real resolution
The honest check on containment is repeat contact rate: did the same customer message again within 24 to 72 hours about the same issue? A high containment rate paired with a high repeat contact rate tells you the bot is deflecting, not resolving. A high containment rate paired with a low repeat contact rate tells you it's actually working. This pairing is the single most useful two-metric combination for judging whether automation is genuinely helping, and it's a core reason escalation design matters in human handoff workflows on WhatsApp.
Setting targets by use case, not a generic benchmark
A FAQ bot should contain 85% or more. A collections or dispute-resolution flow should contain far less, because those conversations often need a human with authority to negotiate. Don't import a generic "industry benchmark containment rate" from a vendor deck. Set the target per use case, based on how much judgment the conversation actually requires.
WhatsApp-specific metrics for South African deployments
Speed-to-reply, journey completion, and conversion
On WhatsApp, speed-to-reply (first response time) correlates directly with journey completion, especially for time-sensitive use cases like appointment confirmations or payment reminders. Track completion rate per journey (started vs finished a flow) separately from conversion rate (finished the flow and took the paid action). These numbers diverge more than teams expect, and the gap between them usually points to a confusing step mid-flow rather than a broken integration.
Collections uplift and no-show reduction examples
South African businesses running WhatsApp reminders for appointments and payments commonly see no-show reductions in the 20 to 35% range and measurable collections uplift when reminders are timed around payday cycles and paired with a direct PayFast or Yoco payment link in the message. These aren't universal numbers, they depend on your base rate, but they're realistic enough to use as a planning assumption rather than a hopeful one.
CSAT on WhatsApp vs email and the 98% open rate context
WhatsApp's roughly 98% open rate (compared to email's 20 to 30%) changes what CSAT actually measures. A low response rate to a CSAT survey on WhatsApp is a signal in itself, not just missing data, because people who are already on the platform and ignoring your survey are telling you something about how the conversation went.
A measurement cadence that doesn't burn your team out
Weeks 1 to 4: weekly reviews
In the first month, review all four layers weekly. This is when integration bugs, prompt gaps, and edge cases surface fastest, and waiting a month to catch them means a month of bad customer experiences compounding.
Months 2 to 3: bi-weekly reviews
Once error rates stabilise and the team isn't shipping daily fixes, move to bi-weekly. Keep sampling conversations manually at this stage; automated scoring alone will miss tone and context issues.
Month 4 onward: monthly reviews with quarterly deep dives
By month four, a stable system needs monthly tracking with a deeper quarterly review that re-examines targets, checks for drift against the original baseline, and decides whether the use case needs to expand. This is also the natural point to revisit whether your original plan is still the right one.
POPIA isn't a feature, it's the floor: building compliance into your metrics review
What an audit trail actually needs to show
A POPIA-relevant audit trail needs to show what data was collected, what it was used for, who (or what system) accessed it, and how long it was retained. For a WhatsApp bot, this means your conversation logs need to record consent status, data category, and retention timestamps, not just the message content.
Folding POPIA checks into your review cadence
The logs you pull to calculate containment rate and repeat contact rate are the same logs a regulator or a customer exercising their rights will ask to see. Fold a POPIA spot-check into your existing weekly or monthly metrics review: are consent flags present, is retention working, is sensitive data flowing anywhere it shouldn't. One review process, two outcomes. The same rigor that catches measurement gaps catches compliance gaps.
Opt-in, data minimisation, and right-to-erasure as ongoing checks
Opt-in consent, data minimisation, and right-to-erasure are not boxes you tick during setup and forget. New data fields get added to flows, new integrations pull in new customer data, and each change needs the same compliance check applied again. For the specifics of what actually needs to be true for POPIA compliance, not just documented, check the detailed POPIA requirements before launch and revisit them quarterly.
Proving ROI to stakeholders in ZAR
Before/after comparison: the only format that convinces a finance team
Finance teams don't want a containment rate, they want a before/after cost comparison in rands. Cost per interaction before (staff hours multiplied by hourly rate) versus cost per interaction after (platform fee plus Meta conversation cost plus amortised build and maintenance cost), multiplied by monthly volume. This is the only format that survives a budget meeting.
Factoring in Meta conversation-based pricing and platform fees
Meta charges per conversation category (marketing, utility, authentication, service), and these rates differ and change. Your ROI math needs to use current category rates, not a flat assumption, and needs to separate Meta's fee from your platform or BSP fee, because stakeholders will ask which is which.
Hidden post-launch costs: NLU retraining, human-in-the-loop handover, integration maintenance
The costs that don't show up in the initial quote are retraining the NLU model as intents drift, maintaining the human-in-the-loop handover process as agents change, and patching integrations when a connected system (CRM, payment gateway, inventory) updates its API. Budget for these as ongoing line items from day one, not as surprises in month six. These add significantly to your total cost of ownership over a system's life.
The 12-month positive ROI target and what it assumes
A 12-month positive ROI target is realistic for most WhatsApp automation projects in South Africa, but it assumes stable volume, a baseline that was actually captured, and no major rebuild mid-year. If any of those assumptions break, the timeline moves. Say that out loud to stakeholders before launch, not after.
Tools for ongoing monitoring
When a spreadsheet is enough
For a single WhatsApp bot handling a few thousand conversations a month, a well-structured spreadsheet or a simple BI dashboard pulling from your logging database is enough. Don't buy monitoring infrastructure you don't need yet.
When you need Prometheus, Grafana, or Evidently-style monitoring
Once you're running multiple bots, agentic workflows, or anything with real-time uptime requirements, move to proper infrastructure monitoring (Prometheus and Grafana for system health) paired with ML-specific monitoring (Evidently or similar for data and prediction drift). This is also the point where oversight checkpoints need to be designed deliberately rather than added as an afterthought.
Detecting drift without ground truth labels
Without labelled "correct" answers to compare against, you can still detect drift by monitoring input distribution changes (are customers asking different questions than before), output confidence score trends, and embedding distance between new queries and your training set. A sudden spike in low-confidence responses or in queries that fall outside your known intent clusters is your earliest warning sign, long before complaints start arriving.
Common questions
How is AI performance measured after deployment? By tracking four layers against a documented pre-launch baseline: system integrity (uptime, latency, error rate), output quality (accuracy, hallucination rate, drift), adoption (activation and retention), and business impact (containment, resolution, cost per interaction). Review weekly in the first month, then bi-weekly, then monthly once the system stabilises.
What KPIs should I track after launch to keep ROI positive? Track containment rate paired with repeat contact rate, cost per interaction in ZAR, three-month retention, and p95 latency. ROI stays positive when containment improves without a corresponding rise in repeat contacts, and when cost per interaction stays meaningfully below the pre-automation human cost.
How do you prove chatbot ROI to stakeholders? Show a before/after cost comparison in rands: staff cost per interaction before automation versus platform fee plus Meta conversation cost plus amortised build cost after. Pair it with containment and retention trends. Finance teams respond to cash numbers, not engagement metrics.
What's the difference between containment rate and resolution rate? Containment rate measures whether a human agent had to step in. Resolution rate measures whether the customer's actual problem got solved. A conversation can be contained without being resolved, which is why repeat contact rate within 24 to 72 hours is needed to check whether containment reflects real resolution.
How do you detect model or data drift without ground truth labels? Monitor input distribution shifts (new types of questions appearing), output confidence score trends over time, and embedding distance between incoming queries and your original training data. A rise in low-confidence outputs or queries outside known intent clusters signals drift before complaints surface.
Is WhatsApp Business API automation POPIA compliant in South Africa? It can be, but compliance isn't automatic. It requires documented opt-in consent, data minimisation in what you store, retention limits, and a working process for right-to-erasure requests. The same logs used for performance metrics should double as your audit trail for these checks.
What should a pre-launch baseline actually include? Average handling time per query type, current error or complaint rate, staff cost per interaction, and a rough customer satisfaction score from existing support tickets. Without these four numbers captured before go-live, you have no honest way to measure improvement afterward.
How often should you review AI performance metrics after go-live? Weekly for the first month, bi-weekly through months two and three, then monthly with a deeper quarterly review from month four onward. The cadence lightens as error rates stabilise, but POPIA and drift checks should stay part of every review, not get dropped once things look stable.
What does a realistic automation or deflection rate look like after launch? For straightforward FAQ or informational use cases, 80 to 90% containment is realistic. For complex or judgment-heavy flows like collections or disputes, 40 to 60% is more honest. Targets should be set per use case based on how much human judgment the conversation genuinely requires.
What hidden costs show up after an AI system goes live? NLU or model retraining as customer language and intents drift, ongoing human-in-the-loop handover management, and integration maintenance when connected systems like CRMs or payment gateways update their APIs. These are recurring costs, not one-time setup fees, and should be budgeted from the start.
If you've launched a WhatsApp bot or AI workflow and aren't sure what to measure next, message Sagentics on WhatsApp and we'll talk through what your numbers actually mean.
Common questions
How is AI performance measured after deployment?
By tracking four layers against a documented pre-launch baseline: system integrity (uptime, latency, error rate), output quality (accuracy, hallucination rate, drift), adoption (activation and retention), and business impact (containment, resolution, cost per interaction). Review weekly in the first month, then bi-weekly, then monthly once the system stabilises.
What KPIs should I track after launch to keep ROI positive?
Track containment rate paired with repeat contact rate, cost per interaction in ZAR, three-month retention, and p95 latency. ROI stays positive when containment improves without a corresponding rise in repeat contacts, and when cost per interaction stays meaningfully below the pre-automation human cost.
How do you prove chatbot ROI to stakeholders?
Show a before/after cost comparison in rands: staff cost per interaction before automation versus platform fee plus Meta conversation cost plus amortised build cost after. Pair it with containment and retention trends. Finance teams respond to cash numbers, not engagement metrics.
What's the difference between containment rate and resolution rate?
Containment rate measures whether a human agent had to step in. Resolution rate measures whether the customer's actual problem got solved. A conversation can be contained without being resolved, which is why repeat contact rate within 24 to 72 hours is needed to check whether containment reflects real resolution.
How do you detect model or data drift without ground truth labels?
Monitor input distribution shifts (new types of questions appearing), output confidence score trends over time, and embedding distance between incoming queries and your original training data. A rise in low-confidence outputs or queries outside known intent clusters signals drift before complaints surface.
Is WhatsApp Business API automation POPIA compliant in South Africa?
It can be, but compliance isn't automatic. It requires documented opt-in consent, data minimisation in what you store, retention limits, and a working process for right-to-erasure requests. The same logs used for performance metrics should double as your audit trail for these checks.
What should a pre-launch baseline actually include?
Average handling time per query type, current error or complaint rate, staff cost per interaction, and a rough customer satisfaction score from existing support tickets. Without these four numbers captured before go-live, you have no honest way to measure improvement afterward.
How often should you review AI performance metrics after go-live?
Weekly for the first month, bi-weekly through months two and three, then monthly with a deeper quarterly review from month four onward. The cadence lightens as error rates stabilise, but POPIA and drift checks should stay part of every review, not get dropped once things look stable.
What does a realistic automation or deflection rate look like after launch?
For straightforward FAQ or informational use cases, 80 to 90% containment is realistic. For complex or judgment-heavy flows like collections or disputes, 40 to 60% is more honest. Targets should be set per use case based on how much human judgment the conversation genuinely requires.
What hidden costs show up after an AI system goes live?
NLU or model retraining as customer language and intents drift, ongoing human-in-the-loop handover management, and integration maintenance when connected systems like CRMs or payment gateways update their APIs. These are recurring costs, not one-time setup fees, and should be budgeted from the start.
About Sagentics
Sagentics is an AI systems studio based in South Africa. We design and build WhatsApp automation, n8n workflows, and custom AI products for local and international clients. We write from systems we have actually shipped.
Start a WhatsApp conversation with SagenticsRelated reading
- Designing AI human oversight: the checkpoints that actually work
- AI system design implementation: what it actually means and why most projects skip it
- AI process mapping: what it is, what it isn't, and whether it's worth paying for
- How to select an AI model for a task
- the real ROI formula for WhatsApp support agents
- what actually needs to be true for POPIA compliance
- what WhatsApp automation costs in ZAR
- how human handoff actually works on WhatsApp
- designing oversight checkpoints that actually work
- why AI projects fail
- a 90-day plan that actually ships
- building human-in-the-loop properly
- total cost of ownership for custom AI
- stopping workflows from failing silently
- what an AI customer service agent costs in South Africa