

 Start a conversation
AI system design and integration
AI process mapping: what it is, what it isn't, and whether it's worth paying for
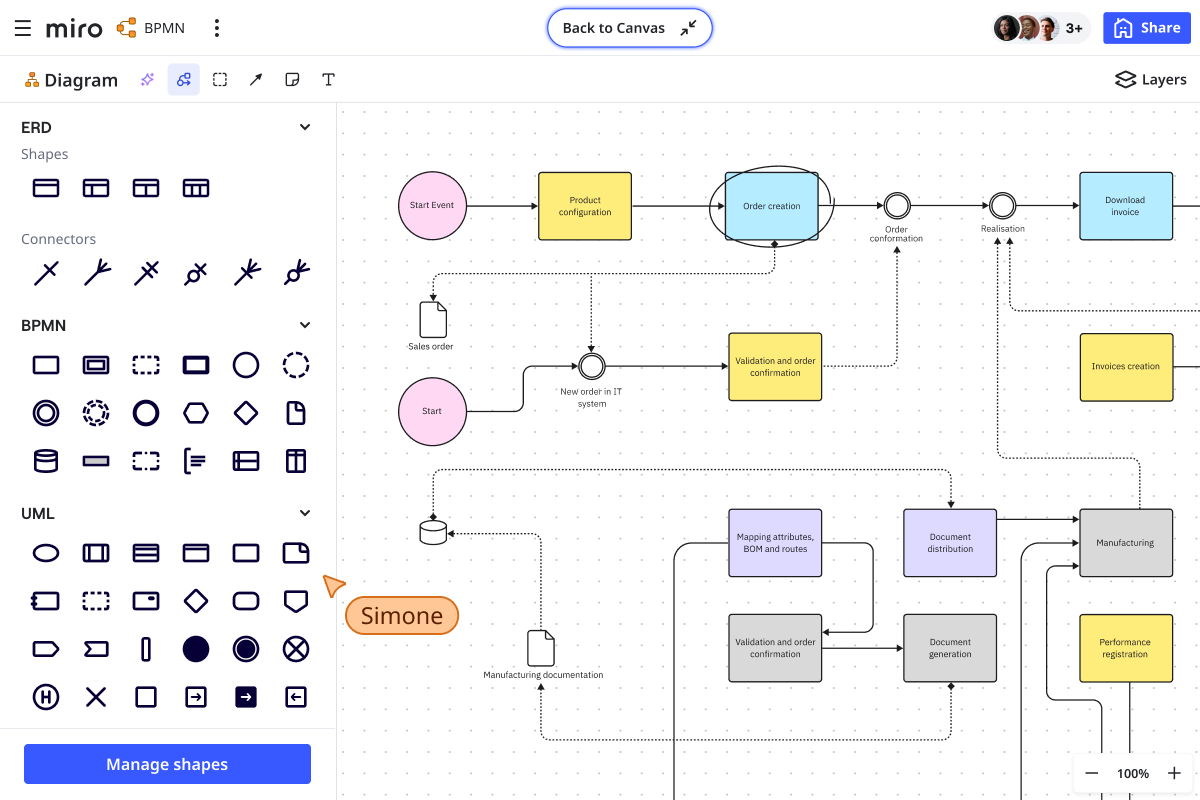
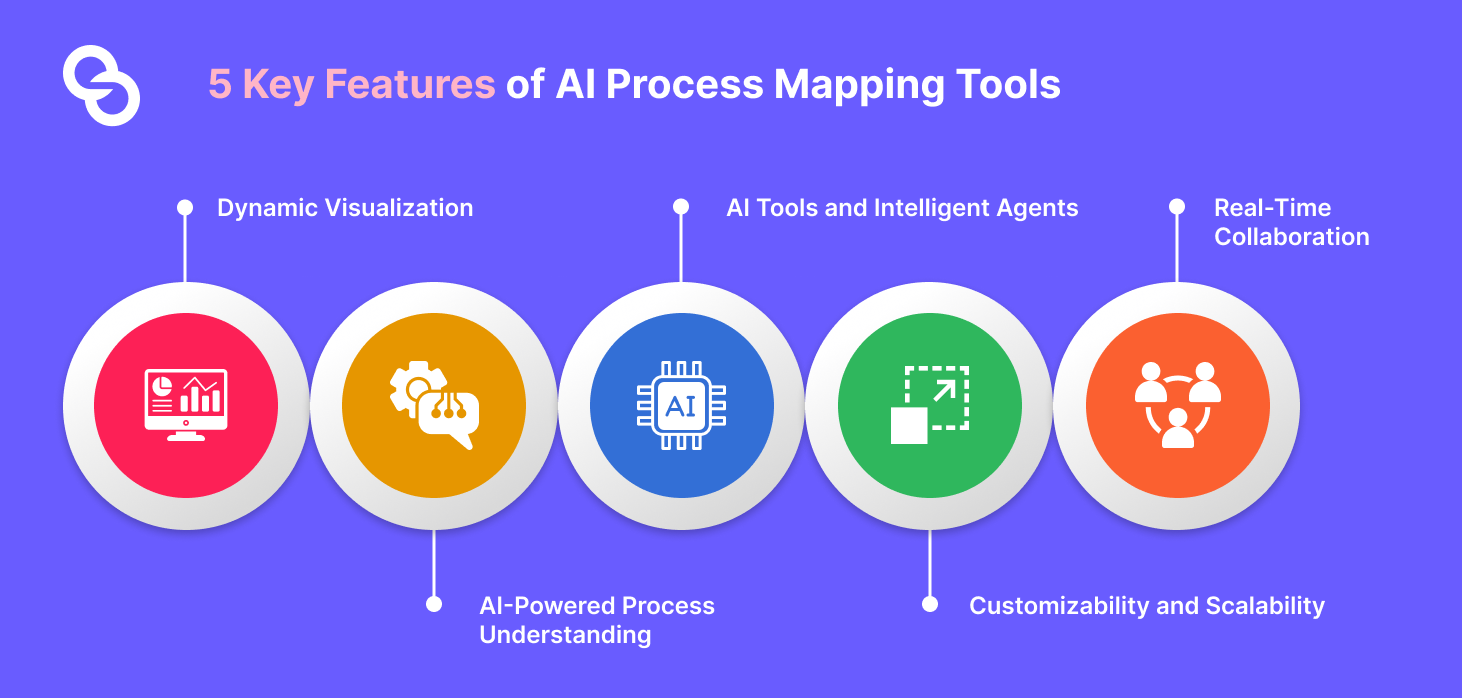
AI process mapping uses machine learning and language models to turn a description, an interview transcript, or a system log into a visual process diagram automatically. It's useful for getting a messy process onto a page fast. But a diagram doesn't run anything on its own, and for most South African businesses the map only earns its keep if it turns into a working n8n workflow rather than staying a picture in Lucidchart, Miro, or a shared Google Drive folder nobody opens again after the project ends.
That distinction, between a map that describes work and a system that does work, is the whole point of this article. Vendors sell the map as the deliverable. We think the map is only step one.
What AI process mapping actually is
Text-to-flow generation vs conversational process queries vs process mining
There are three different things hiding under the "AI process mapping" label, and they get confused constantly.
Text-to-flow generation takes a written description (you type "customer submits a quote request, sales reviews it, finance approves over R10,000, PDF goes out") and produces a flowchart automatically. Conversational process query tools let you ask an AI assistant questions about an existing process map, like "where does this break if the approver is on leave." Process mining is different again: it reads actual system event logs including timestamps, user actions, and system records, then reconstructs what really happened, not what someone said happens.
All three get marketed as "AI process mapping" because the category is young and vendors stretch the term. Only the first two are mapping in the traditional sense. The third is a different discipline with a different data requirement.
How it differs from a manual flowchart or swim lane diagram
A manual flowchart is drawn by a person, usually an ops manager or consultant, sitting with stakeholders and sketching boxes and arrows based on what people tell them. It's slow, it depends on who's in the room, and it goes stale the moment the process changes.
AI process mapping speeds up the drawing part. You describe the process in plain language or paste in an existing SOP document, and the tool generates the diagram in minutes instead of hours. The swim lanes, decision diamonds, and handoff points still exist, they just get produced faster and with less manual drag-and-drop.
What doesn't change: the diagram is still just a description. Faster drawing is not the same as faster execution.
What the AI is actually doing under the hood (and what it isn't)
Under the hood, these tools are mostly large language models trained to recognise process language, things like "if," "then," "approved by," "escalates to," and convert that structure into a directed graph. Some tools add a layer that reads structured data (spreadsheets, CRM exports) to pre-fill steps.
What the AI isn't doing is understanding your business. It has no idea that your finance approver is usually out of office on Fridays, or that your WhatsApp order confirmations silently fail for 8% of customers. It's a language-to-diagram translator, not a business analyst. This matters because it's the reason diagrams need human review before anyone builds on top of them, which we cover below.
Process mapping vs process mining: the distinction that matters
Mapping shows how people think work happens, mining shows what the system logs prove
Process mapping captures the process as described by the people running it. That description is useful but biased: people describe the happy path, skip the exceptions, and forget the workaround they invented six months ago because the "official" step was too slow.
Process mining skips the interview entirely and reads timestamped event data from your systems, your CRM, your accounting software, your WhatsApp Business API logs, to reconstruct what actually happened across thousands of real cases. It shows the process as it is, warts and all, not as it's described in the SOP document.
Why mining can't replace mapping (and mapping can't replace mining)
Mining needs clean, structured, timestamped data to work. Most South African SMEs don't have that. Orders come in over WhatsApp, approvals happen over email, and half the process lives in someone's head. Mining has nothing to mine.
Mapping, on the other hand, can be wrong, because it reflects what people believe happens rather than what the data proves. Neither tool catches everything alone. A business with clean system logs benefits from mining to find the real bottleneck, then mapping to design the fix. A business without that data infrastructure, which describes most SA SMEs, needs mapping first, because there's no log to mine yet.
Which one actually finds your bottlenecks
Mining is better at finding bottlenecks if you have the data for it, because it measures actual cycle times and real deviation from the standard path across real cases, not opinions. Mapping is better at finding bottlenecks if you don't have clean logs, because a skilled interviewer (human or AI-assisted) can surface the "oh yeah, that approval always sits for three days" problem that never shows up cleanly in a spreadsheet.
For most of our clients, who run lean teams without a data warehouse, mapping combined with a short diagnostic conversation finds 80% of the real bottleneck faster than setting up a mining pipeline would.
Why a mapped process isn't an automated process
The gap between a diagram and a running workflow
This is the part most vendors gloss over. A diagram, no matter how accurately AI-generated, is a picture. It doesn't send a WhatsApp message, doesn't check a PayFast payment status, doesn't update a Google Sheet, and doesn't escalate an overdue invoice. Turning that picture into something that runs requires building the actual workflow logic, connecting the right APIs, handling errors, and testing it against real data. That's a separate project with its own skill set, covered in detail in what n8n workflow automation actually involves.
Why AI-generated maps can create false confidence
Because the AI produces a clean, professional-looking diagram fast, there's a temptation to treat it as finished work. Teams present the map in a steering committee meeting, everyone nods, and the project gets marked as "process documented." Nothing has actually changed about how work gets done. The false confidence comes from mistaking a polished artifact for a solved problem, which is exactly why most AI projects skip proper system design and jump straight to tool selection instead.
What needs human validation before you build anything on top of it
Before any automation gets built on top of an AI-generated map, someone who actually does the work needs to walk through every branch and confirm: does this exception really happen the way the AI assumed, does this approval step actually require a human, and what happens when the API call fails. Skipping this step is how automations get built on a fictional version of the process, and it's also why workflows fail silently without proper error handling once they hit a real-world edge case the map never accounted for.
The Sagentics angle: map, then ship the automation
Why we map inside n8n instead of handing over a diagram
Most vendors sell the map as the deliverable. We've found the opposite problem on client projects: the map is worthless the day the project ends unless it's already wired into something that runs. When we map a process for a South African client, we do it inside n8n from the start, so the diagram and the live workflow are the same object. There's no handoff moment where a nicely drawn swim lane diagram sits in a shared drive while the actual work keeps happening the old way.
This is also why we're skeptical of pure text-to-flow tools. They're fast at drawing a process, but speed to diagram isn't the bottleneck for most SA businesses. Speed to a working WhatsApp or back-office automation is.
What "living map" means when the map is a running workflow
A living map means the boxes and arrows you see are literally the n8n nodes executing in production. When the process changes, you edit the workflow, and the map updates itself because it never stopped being the map. There's no second document to maintain, no drift between what's documented and what's actually running.
A real example: mapping a quote-to-invoice process straight into automation
A Cape Town-based distributor came to us with quotes going out over email, approvals happening over WhatsApp, and invoices generated manually in an accounting package days later. We didn't draw a diagram and schedule a follow-up meeting. We mapped the process directly into n8n: quote request triggers a template, approval over a certain ZAR threshold pings the right person on WhatsApp, approved quotes auto-generate the invoice and push it to the accounting system. The map and the automation were finished at the same time, which is the pattern we use for mapping a quote-to-invoice loop directly into n8n on most back-office projects.
What this costs in South Africa
Typical ZAR ranges for mapping-led automation projects
Mapping-led automation projects in South Africa, where discovery and build happen together rather than as separate phases, typically run from R15,000 for a single focused workflow (one WhatsApp flow or one document automation) up to R120,000+ for a multi-process back-office overhaul touching quotes, invoicing, and stock. For a fuller breakdown by project size, see a real ZAR range for AI build timelines.
Where the 30 to 50% efficiency gains actually come from
The efficiency gains quoted in this space (vendors love throwing around "30-50% faster") come almost entirely from removing manual re-entry and chase-up time, not from the mapping itself. Someone retyping a WhatsApp order into an invoice system, or chasing an approver by phone because the email got buried, is where the hours disappear. Automating those handoffs is where the gain lives, not in having a prettier diagram of the process.
Payback timelines for common processes (invoicing, approvals, support)
Invoicing automation tends to pay back fastest, often within two to four months, because it removes direct admin hours and speeds up cash collection. Approval workflows pay back in three to six months depending on deal volume. Support automation (WhatsApp-based query triage) usually pays back in four to eight months, since the gain is mostly staff time freed up rather than direct cost removal. Whether the maths works for your specific volume is worth checking before committing, which is the whole question behind whether n8n automations actually pay for themselves.
Is it safe for sensitive or regulated process data?
POPIA considerations when AI tools touch your process data
If your process involves customer ID numbers, medical information, or financial records, feeding that data into a cloud-based AI mapping tool raises real POPIA questions about where the data goes, who processes it, and whether there's a lawful basis for an offshore AI vendor to touch it. Most AI process mapping tools are hosted overseas by default, which means you need to check their data processing terms before pasting real customer records into a prompt box.
Where process data should live during mapping and after
Our approach is to map with anonymised or representative sample data, never live customer records, and only connect the automation to real data once it's running inside infrastructure you control (self-hosted n8n or a properly configured cloud instance with data residency clarity). This mirrors the approach we use for WhatsApp-based automations, where what actually needs to be true for POPIA compliance is less about the AI tool and more about where the data lives and who can access it afterward.
Tools compared: diagramming, mining, and automation-native
Lucidchart, Visio, Miro: diagramming with light AI
These are the traditional diagramming tools, now with AI features bolted on (text-to-diagram, auto-layout suggestions). They're good for presenting a process to stakeholders and bad for anything operational, because the diagram has no connection to any system that actually does the work.
Celonis, KYP.ai, Signavio: process mining and discovery
These are enterprise process mining platforms. They need structured system logs and a data engineering effort to set up, which puts them out of reach for most SA SMEs and squarely in the territory of large corporates with ERP systems already generating clean event data.
Zapier Canvas, Make, and n8n: map becomes the workflow
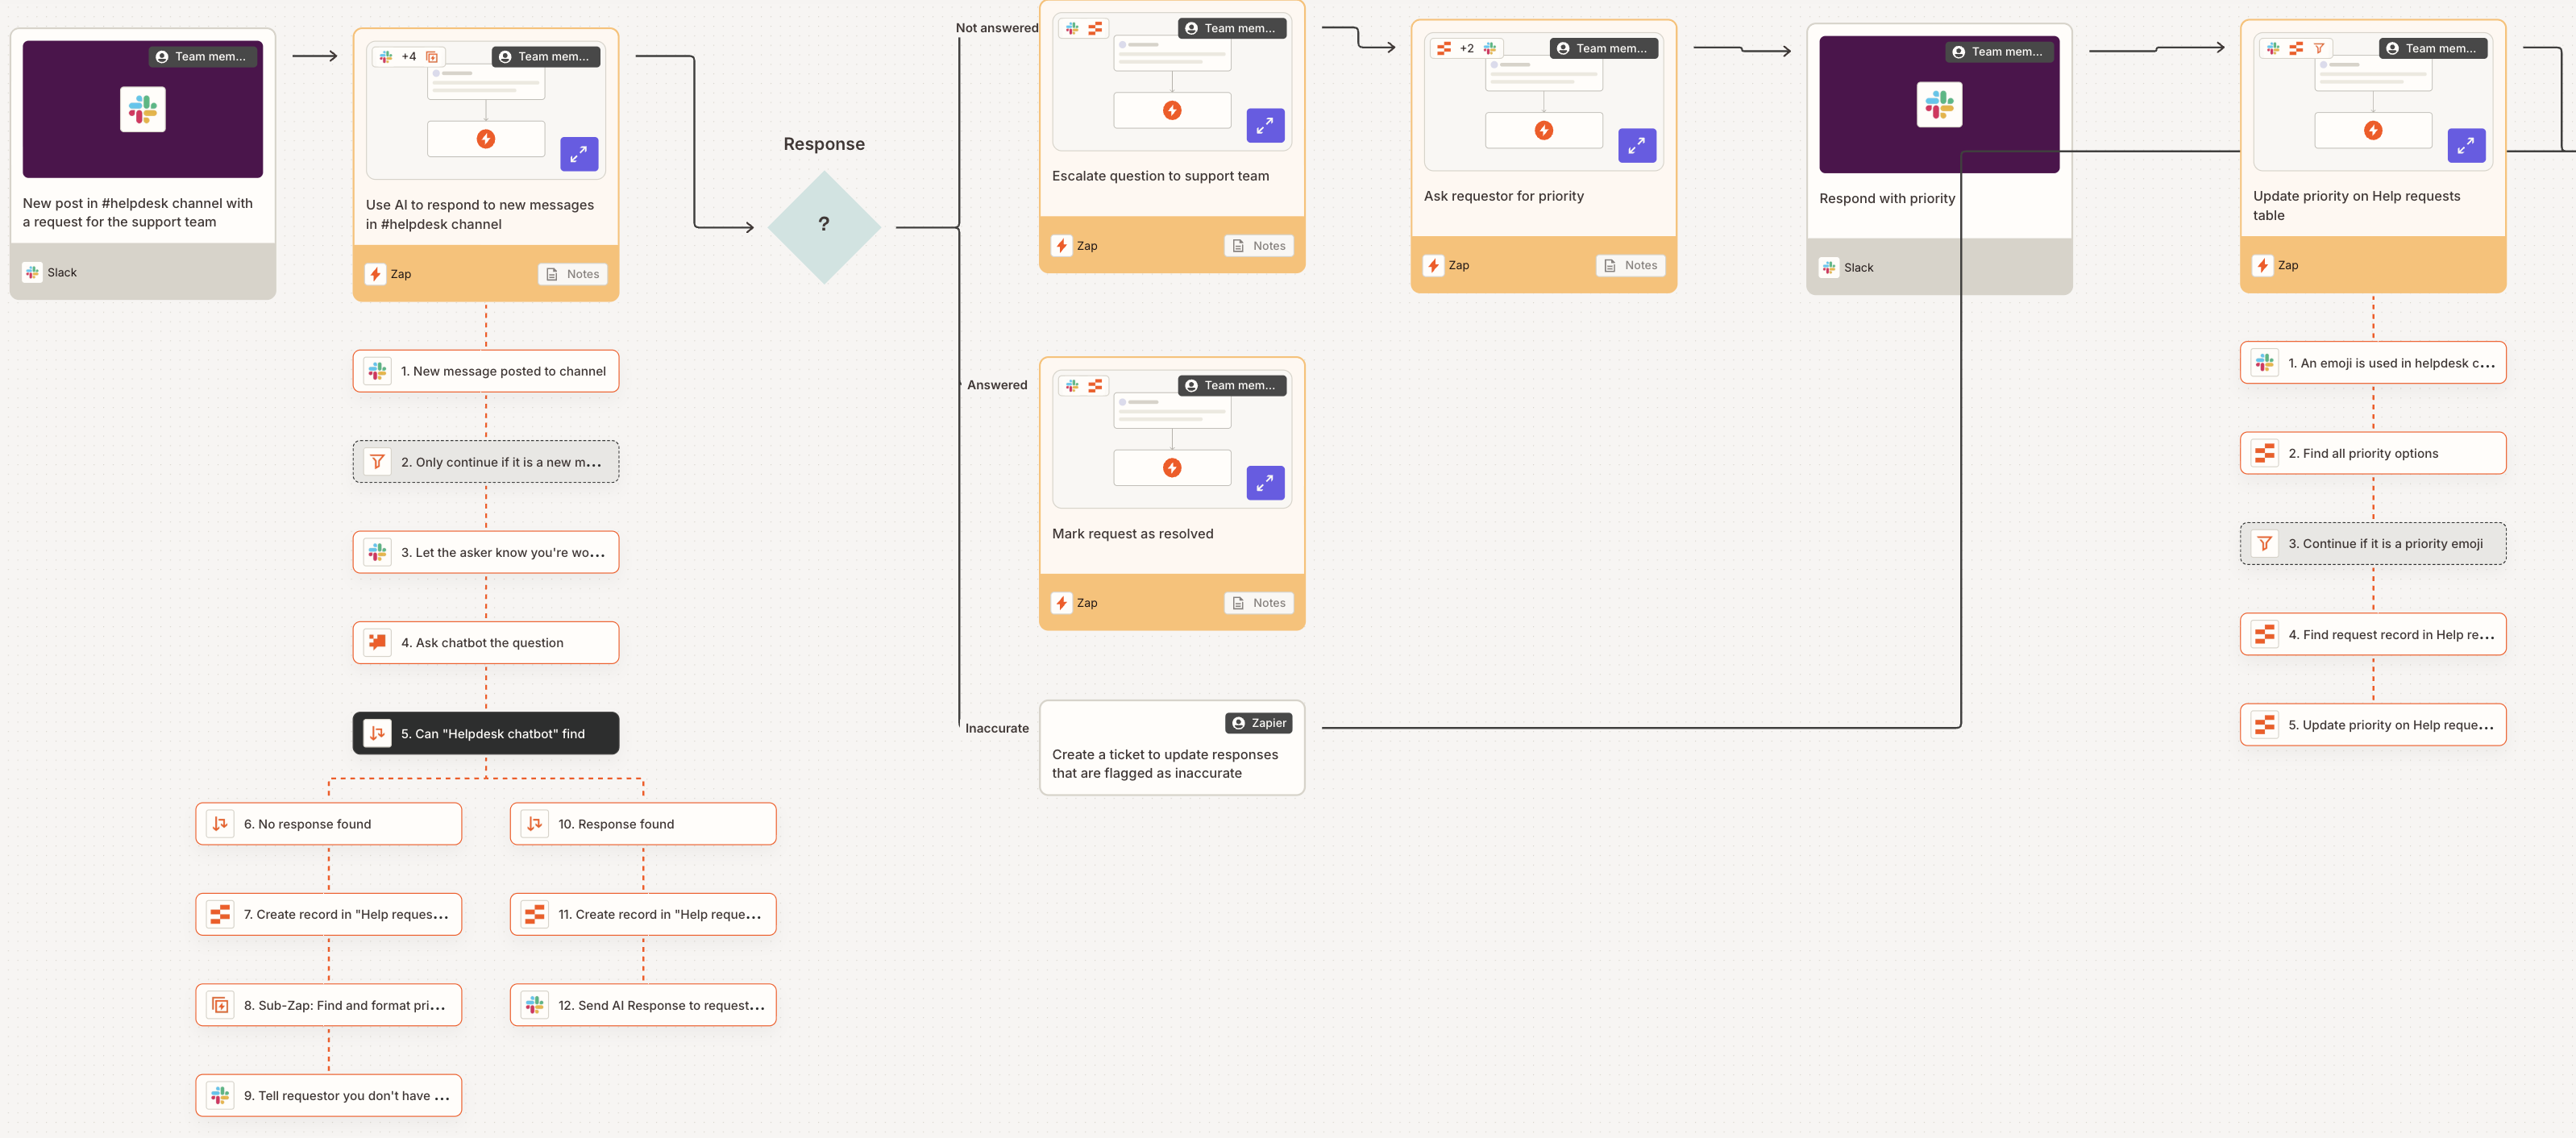
This is the automation-native category, where the visual map and the running automation are built in the same canvas. Zapier Canvas does this at a basic level. n8n does it with far more flexibility, self-hosting options, and no per-task pricing trap, which is a big part of the decision rule for n8n versus custom code when SA businesses are comparing platforms.
How to decide what you actually need
You need mapping if you don't know how the process really works
If nobody in the business can draw the current process accurately on a whiteboard without arguing, start with mapping. You need to agree on reality before you automate it.
You need mining if you have system logs and suspect hidden delays
If you already have clean, timestamped data in a CRM or ERP and suspect there's a bottleneck nobody can name, mining will find it faster than interviews will. This is rare among SA SMEs but common in larger operations.
You need an automation build if you already know the process and just want it running
If the process is well understood and the only gap is that it's manual, skip the mapping exercise and go straight to a build. This is also the point where it's worth getting the honest build vs buy answer for South African businesses, since off-the-shelf tools sometimes cover 80% of what you need without a custom build at all.
Common questions
What is AI process mapping and how is it different from a regular flowchart? AI process mapping uses language models to generate a flowchart automatically from a description or document, instead of someone manually drawing boxes and arrows. The output looks similar to a regular flowchart, but it's produced faster and can be regenerated quickly when the process changes, provided someone keeps feeding it accurate input.
What's the difference between process mapping and process mining? Mapping documents how people describe a process working, usually through interviews or written descriptions. Mining reconstructs how a process actually worked by analysing timestamped system logs. Mapping needs no data infrastructure and reflects human understanding. Mining needs clean structured data and reflects system reality, including the exceptions people forget to mention.
Can process mining replace process mapping entirely? No. Mining only works where clean, structured, timestamped data already exists, which rules out most processes that run partly over WhatsApp, email, or phone calls. Mapping captures tacit knowledge and informal workarounds that never appear in a system log. Most South African businesses need mapping first simply because the data mining requires doesn't exist yet.
Which method is better for finding bottlenecks? Mining wins when clean system data exists, because it measures real cycle times across many cases rather than opinions. Mapping wins when data is messy or incomplete, because a good interview surfaces informal delays mining can't see. Most SA SMEs get further, faster, with mapping plus a short diagnostic conversation.
Does AI process mapping require technical or data science expertise to implement? No. Most AI process mapping tools work from plain language input, typed descriptions or uploaded SOP documents, and need no coding or data science background to use. The technical expertise becomes necessary later, when turning the map into an actual running automation rather than leaving it as a diagram.
Does a mapped process automatically become an automated one? No, and this is the core misunderstanding in the category. A map is a description, not a system. It takes a separate build effort, connecting APIs, handling errors, testing against real data, to turn that description into something that actually executes. Skipping this step is why many "digital transformation" projects produce diagrams but no measurable change.
How much does business process automation cost in South Africa? Projects typically range from R15,000 for a single focused workflow to R120,000+ for a multi-process overhaul spanning quotes, invoicing, and stock. Cost depends on the number of systems integrated, data complexity, and whether error handling and monitoring are included. Payback usually lands within two to eight months depending on the process automated.
What are real examples of AI process mapping in healthcare, finance, customer service, or manufacturing? In South Africa this usually looks like mapping patient intake-to-billing flows in small clinics, quote-to-invoice loops in distribution and finance, WhatsApp-based customer query triage in retail, and stock reconciliation steps in light manufacturing. In each case, the value only materialises once the mapped steps are wired into a running n8n automation.
Is AI process mapping safe for sensitive or POPIA-regulated data? Only if handled carefully. Most cloud AI mapping tools are hosted offshore, so feeding real customer records into them raises POPIA questions about data residency and lawful processing. The safer approach is mapping with anonymised sample data and only connecting live customer data once the automation runs on infrastructure you control.
If you're trying to work out whether your process needs mapping, mining, or just a straight build, message us on WhatsApp and we'll walk through it with you, no pitch deck required.
Common questions
What is AI process mapping and how is it different from a regular flowchart?
AI process mapping uses language models to generate a flowchart automatically from a description or document, instead of someone manually drawing boxes and arrows. The output looks similar to a regular flowchart, but it's produced faster and can be regenerated quickly when the process changes, provided someone keeps feeding it accurate input.
What's the difference between process mapping and process mining?
Mapping documents how people describe a process working, usually through interviews or written descriptions. Mining reconstructs how a process actually worked by analysing timestamped system logs. Mapping needs no data infrastructure and reflects human understanding. Mining needs clean structured data and reflects system reality, including the exceptions people forget to mention.
Can process mining replace process mapping entirely?
No. Mining only works where clean, structured, timestamped data already exists, which rules out most processes that run partly over WhatsApp, email, or phone calls. Mapping captures tacit knowledge and informal workarounds that never appear in a system log. Most South African businesses need mapping first simply because the data mining requires doesn't exist yet.
Which method is better for finding bottlenecks?
Mining wins when clean system data exists, because it measures real cycle times across many cases rather than opinions. Mapping wins when data is messy or incomplete, because a good interview surfaces informal delays mining can't see. Most SA SMEs get further, faster, with mapping plus a short diagnostic conversation.
Does AI process mapping require technical or data science expertise to implement?
No. Most AI process mapping tools work from plain language input, typed descriptions or uploaded SOP documents, and need no coding or data science background to use. The technical expertise becomes necessary later, when turning the map into an actual running automation rather than leaving it as a diagram.
Does a mapped process automatically become an automated one?
No, and this is the core misunderstanding in the category. A map is a description, not a system. It takes a separate build effort, connecting APIs, handling errors, testing against real data, to turn that description into something that actually executes. Skipping this step is why many 'digital transformation' projects produce diagrams but no measurable change.
How much does business process automation cost in South Africa?
Projects typically range from R15,000 for a single focused workflow to R120,000+ for a multi-process overhaul spanning quotes, invoicing, and stock. Cost depends on the number of systems integrated, data complexity, and whether error handling and monitoring are included. Payback usually lands within two to eight months depending on the process automated.
What are real examples of AI process mapping in healthcare, finance, customer service, or manufacturing?
In South Africa this usually looks like mapping patient intake-to-billing flows in small clinics, quote-to-invoice loops in distribution and finance, WhatsApp-based customer query triage in retail, and stock reconciliation steps in light manufacturing. In each case, the value only materialises once the mapped steps are wired into a running n8n automation.
Is AI process mapping safe for sensitive or POPIA-regulated data?
Only if handled carefully. Most cloud AI mapping tools are hosted offshore, so feeding real customer records into them raises POPIA questions about data residency and lawful processing. The safer approach is mapping with anonymised sample data and only connecting live customer data once the automation runs on infrastructure you control.
About Sagentics
Sagentics is an AI systems studio based in South Africa. We design and build WhatsApp automation, n8n workflows, and custom AI products for local and international clients. We write from systems we have actually shipped.
Start a WhatsApp conversation with SagenticsRelated reading
- AI system design implementation: what it actually means and why most projects skip it
- what n8n workflow automation actually involves
- whether n8n automations actually pay for themselves
- why most AI projects skip proper system design
- mapping a quote-to-invoice loop directly into n8n
- the decision rule for n8n versus custom code
- the honest build vs buy answer for South African businesses
- what actually needs to be true for POPIA compliance
- a real ZAR range for AI build timelines
- what ecommerce back office automation covers
- how to choose a custom AI development partner
- why workflows fail silently without proper error handling
- Sagentics' AI automation work in South Africa